Async Telemetry Pipeline
Decoupled metric collection from processing ensures zero impact on application latency.
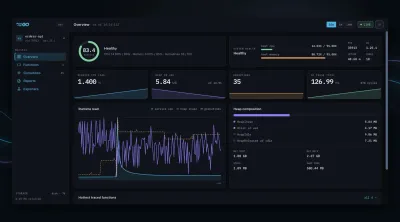
Drop-in performance monitoring for any Go application - from REST APIs to background workers. Add three lines of code and get a live dashboard, Prometheus metrics, and OpenTelemetry export out of the box.
Twenty seconds: one line of Go, then the dashboard it gives you — real capture, real numbers, no narration.
Async Telemetry Pipeline
Decoupled metric collection from processing ensures zero impact on application latency.
Adaptive Sampling
Intelligent function tracing captures heavy profiles (CPU / Heap) only for a sampled percentage of calls, keeping overhead negligible.
Pluggable Storage
Persistent disk storage via tstorage or volatile in-memory storage for containerized and short-lived environments.
Headless Mode
Run MoniGo as a background telemetry agent without the dashboard UI.
Prometheus & OTel
Built-in /metrics endpoint and OpenTelemetry Collector export - plug into your existing observability stack.
Dashboard Security
Built-in middleware for Basic Auth, API Key, IP Whitelist, and Rate Limiting to protect your monitoring endpoints.